Board of Directors Situation Report
ECONOMIC SITUATION
In early 2016, economic growth slowed down both in advanced economies and on emerging markets. However, in the second half of the year, the mood across the global economy started to improve to the extent that optimism prevailed at the end of 2016. This is also true of the euro area’s economy, which is good news for Central Europe.
The reversal of trends on the commodity markets was a key event of 2016, when oil prices rose slightly after a prolonged plunge. The slow increase in the price of oil eliminated a glaring imbalance in the global economy, paving the way for more robust, more sustainable economic growth.
Growth in prices of oil and other commodities is an inflation trigger. Inflation was not uniform among advanced economies, with disparities particularly apparent between developments in the euro area and the USA. This intensified the divergence of major central banks’ monetary policies in 2016. The ECB cut its rates further and broadened its asset-buying programme, which will remain in place at least until the end of 2017. In contrast, the US Fed raised interest rates in December and is expected to hike them up further this year. The Fed’s monetary policy actions fuelled the appreciation of the dollar and growth in government bond yields in both the US and Europe, including the Central European region. The optimism surrounding US economic growth, coupled with the inauguration of a new president, has lifted the mood on the equity markets.
There was a marked slowdown in Czech economic growth in 2016 due to the reduced take-up of European funds and the resulting decline in the capital expenditure co-financed by those funds. Household consumption was the economy’s main driver in 2016 and should continue to be so this year. Rising consumption has been underpinned by reassuring developments on the labour market, translating into lower unemployment and accelerating wage and salary growth. Household consumption growth is proof that the Czech economy is in very good shape, despite the generally weaker GDP growth.
The Czech economy was not spared inflation growth either: headline inflation at the end of 2016 came to 2%, on a par with the CNB’s inflation target. In 2017, the CNB is expected to jettison its commitment to keep the exchange rate above CZK 27 per EUR. The lifting of the CNB’s exchange rate commitment will be an important step both for the Czech economy and financial markets. Economic fundamentals plead in favour of a stronger Czech currency. However, in view of the high volume of speculative positions banking on the future appreciation of the crown, it is quite possible that the crown will be volatile directly after the termination of the exchange rate commitment, so the exchange rate could fluctuate quite wildly in both directions.
The influx of speculative money, drawn by the CNB’s exchange rate commitment, pushed the yields of shorter-term CZK-denominated government bonds into negative territory. Longer yields also stooped very low. The outlook for global monetary policy and the predicted dropping of the CNB’s exchange rate commitment in 2017 should increase the yields of CZK-denominated government bonds, though longer-term bonds are likely to register little movement as the way the monetary policy in the euro area has been configured should dampen market fluctuations.
INSURANCE INDUSTRY
Statistics compiled by the Czech Insurance Association (ČAP) for 2016 indicated that its member companies’ total written premiums had climbed by 2.1% year on year to CZK 118.5 billion. Life insurance continued along its downward path, sinking 1.8% overall year on year.
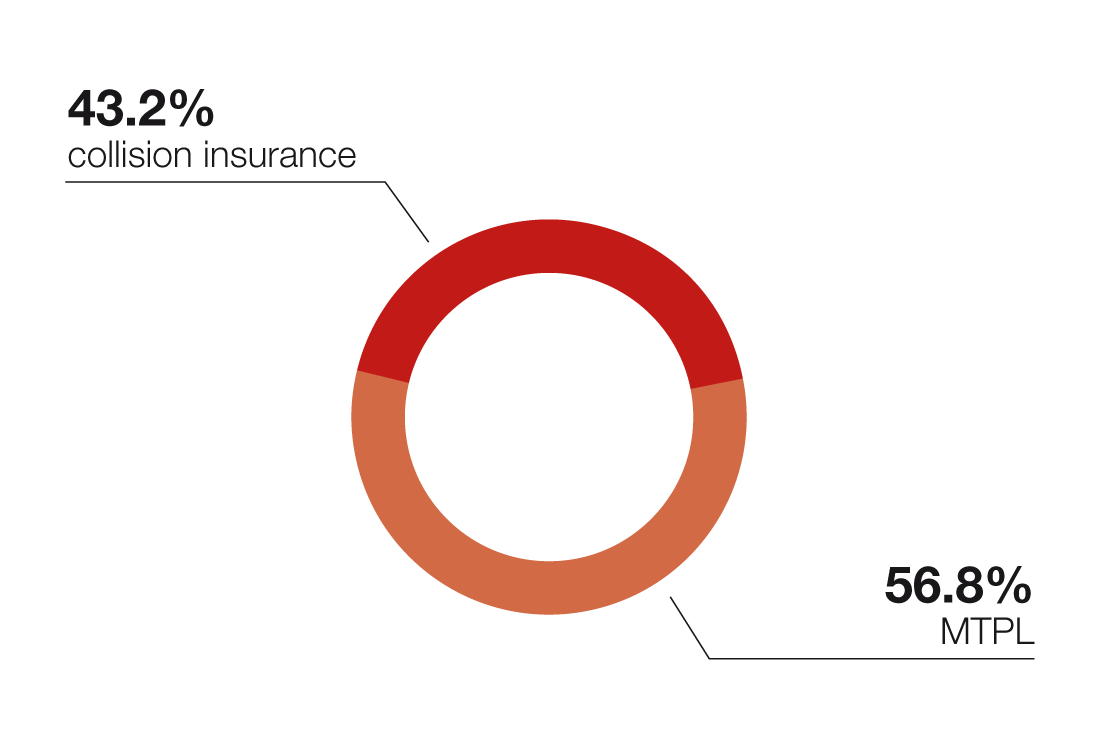
Non-life insurance intensified at an even faster pace than in the previous two years, rising by 4.5% compared to 2015. The main contributor to the total written premiums in excess of CZK 74.8 billion was motor insurance (MTPL and collision insurance). Business insurance grew at a similar rate, but other areas of insurance stalled.
The absolute winner in 2016 was collision insurance, which improved 9.5% year on year. The increase in written premiums by nearly CZK 1.5 billion accounts for almost half the growth in non-life insurance. MTPL contributed a further CZK 0.5 billion to growth. The higher number of insurance contracts played a decisive role in the positive development of both motor insurance products. The rise in collision insurance was boosted by growing sales of new vehicles, while MTPL benefited from the higher overall number of vehicles registered.
Business insurance, building on sound economic growth, increased its written premiums and expanded by 3.4%.
In contrast, the volume of life insurance shrank for the third consecutive year in 2016, this time by CZK 0.8 billion. Amid low interest rates, single-premium life insurance contracted by approximately a quarter (23.6%) for the second year running. Regular-premium life insurance slowed down its year-on-year decline, dipping by 0.8%. As new business continues to decline (this time by 9% year on year), near-future trends in written premiums look rather bleak. In December, an amendment to the Insurance Intermediaries Act entered into force which set the requirement of a five-year liability for commission. This which may deter some intermediaries and have adverse repercussions.
A prominent trend in the market of regular-premium life insurance has been the move away from unit-linked insurance in favour of term insurance, which is good news for the insurance market.
In 2016, Generali reaffirmed its long-standing market position among the four largest players on the Czech insurance market. It is the sixth largest life insurer, holding a 7.1% market share, and the fifth most powerful insurance company in non-life insurance, claiming a 7.2% market share.
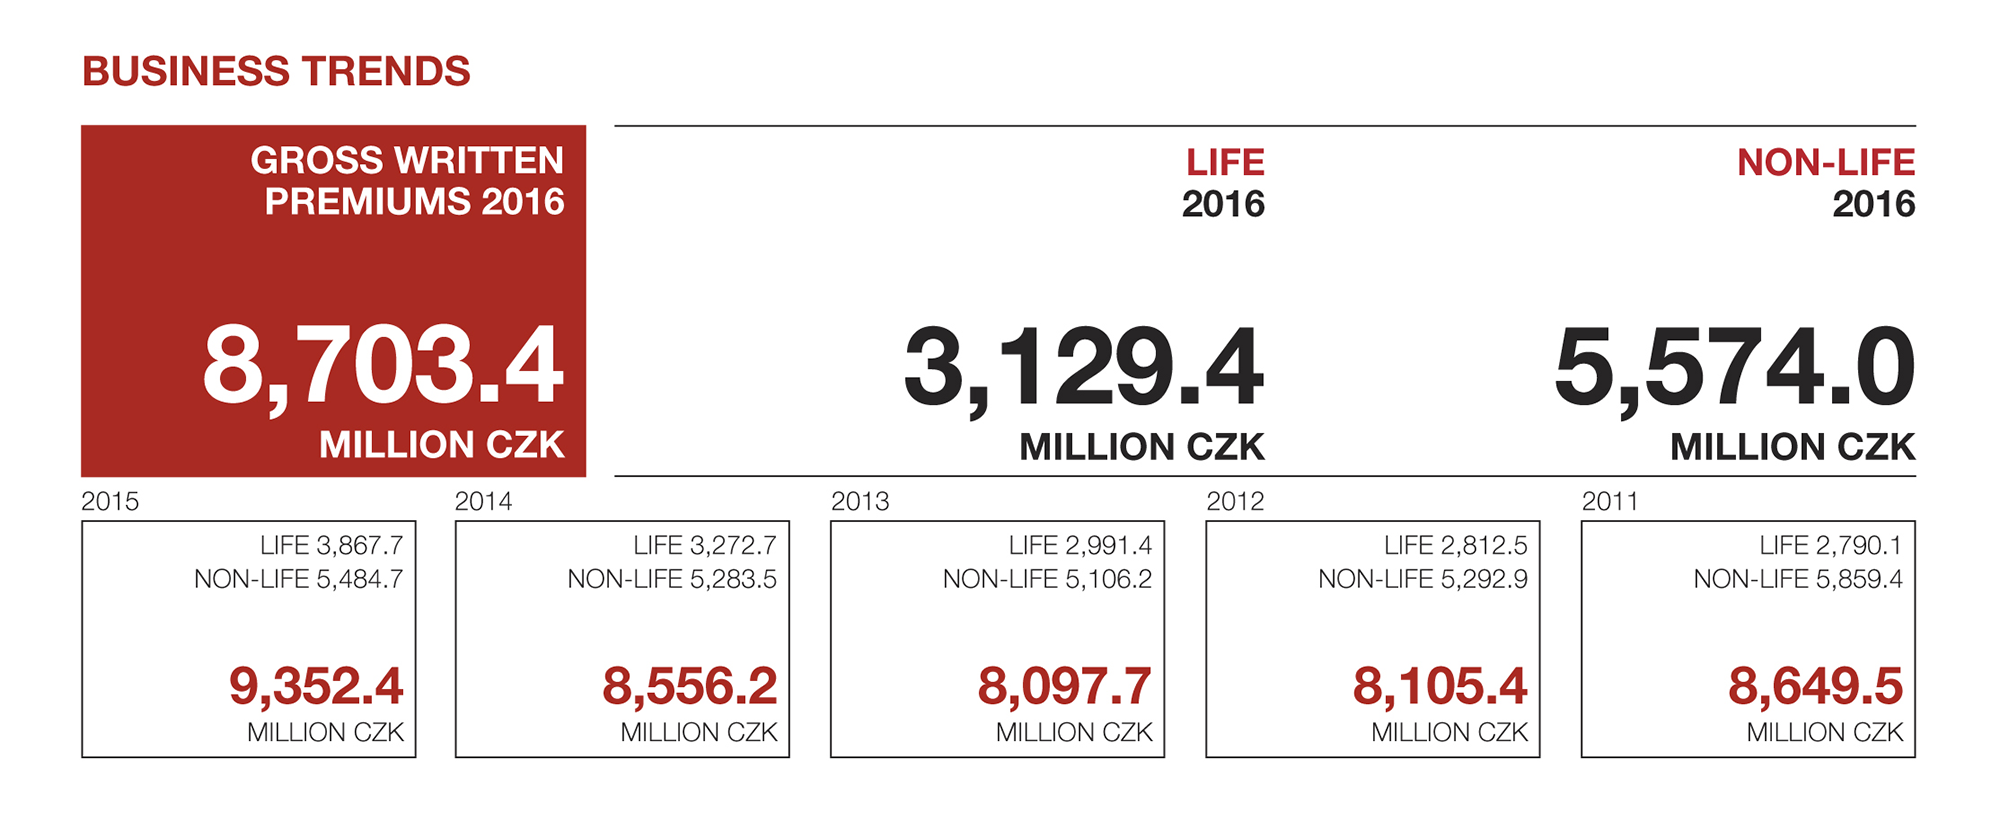
As at 31 December 2016, Generali was managing more than 1,599,778 insurance contracts. Gross written premiums totalled CZK 8,703.4 million, down from CZK 9,352.4 million in the previous year. Life insurance written premiums came to CZK 3,129.4 million. Overall non-life insurance billing climbed to CZK 5,574 million.
Technical provisions at the Company are set at such a level that, in keeping with accepted actuarial rules, all liabilities to customers can be met. Provisions are safely covered by capital investments. Technical provisions under life and non-life insurance, totalling CZK 15.9 billion, are backed by capital investments worth CZK 22.7 billion.
Our investments are governed by the principles of maximum security, reasonable profitability and sufficient liquidity. We diversify funds in a multifaceted portfolio. Much of the investment has been channelled into government bonds, CZK Eurobonds and time deposits at reputable financial institutions. Our sensible investment policy bore fruit once again in 2016, at a time when reverberations from the economic recession experienced in recent years were still being felt on the Czech insurance market.
Claims costs amounted to CZK 3,292.6 million. Non-life insurance claims paid, including claims handling expenses, came to CZK 1,742.1 million. Life insurance claims stood at CZK 1,550.5 million.
In defiance of the hard-hitting macroeconomic impacts on the Czech insurance market, Generali made a profit of almost CZK 480.9 million. This result can be attributed to three key factors: a prudent investment policy, the efficient management of operating costs, and the technical results of selected types of insurance. No events have occurred in our business operations so far that could affect the planned annual result for 2017. A customer-oriented approach remains our top priority, and as such Generali devotes considerable effort and funds to this goal.
We are trying to increase written premiums in all encouraging lines of insurance while keeping a lid on any growth in costs. In the next few years, we expect to improve our economic performance – with growth to match – while consolidating our market position.
In conclusion, we would like to convey our gratitude in particular to our customers and business partners for their confidence in Generali. We would also thank all of our employees, captive and independent insurance agents, insurance brokers and all those who contribute to the Company’s development every day.
Personal Insurance
| CZK millions | 2016 | % | 2015 | % | 2014 | % |
|---|---|---|---|---|---|---|
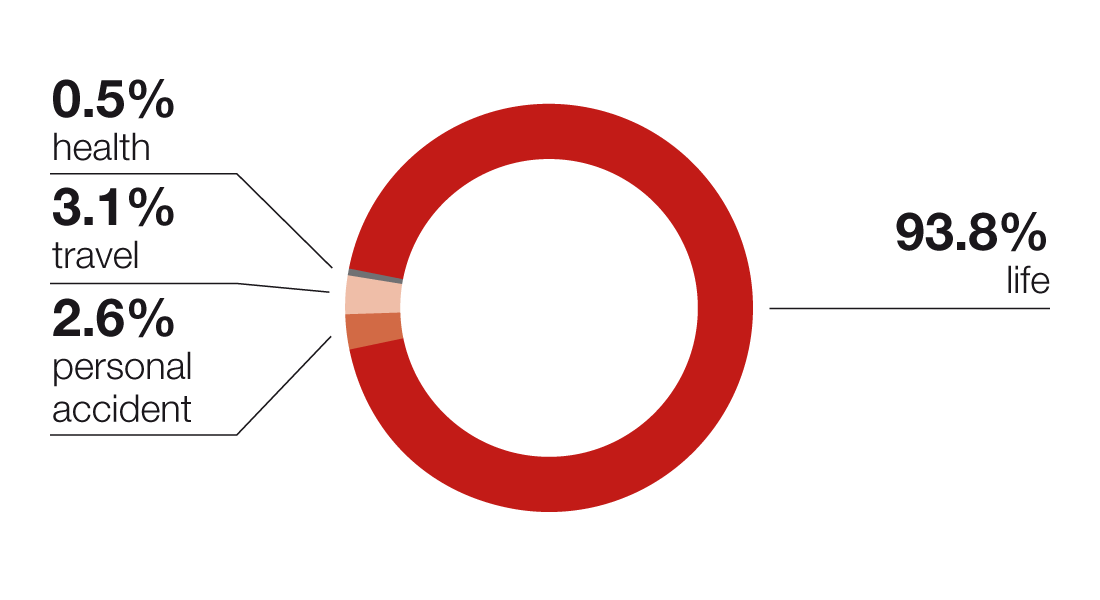
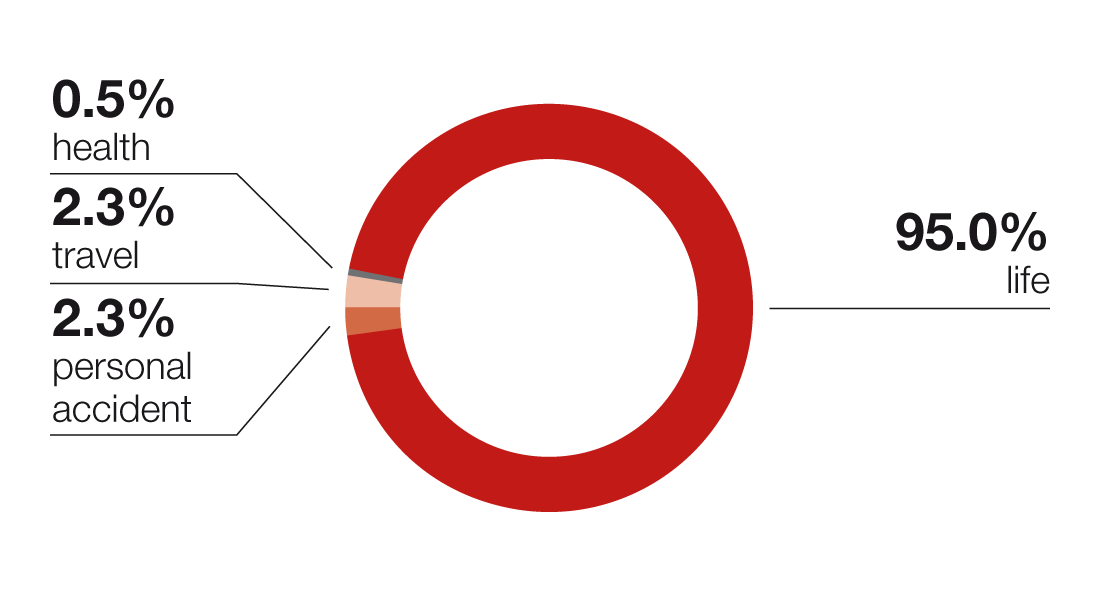
| Life | 3,129.4 | 93.8% | 3,867.7 | 95.0% | 3,272.7 | 93.1% |
| Personal accident | 86.4 | 2.6% | 93.4 | 2.3% | 101.6 | 2.9% |
| Travel | 102.4 | 3.1% | 92.8 | 2.3% | 121.6 | 3.5% |
| Health | 17.8 | 0.5% | 18.9 | 0.5% | 20.0 | 0.6% |
| Total | 3,336.0 | 100.0% | 4,072.8 | 100.0% | 3,515.9 | 100.0% |
| CZK millions | 2013 | % | 2012 | % | 2011 | % |
|---|---|---|---|---|---|---|
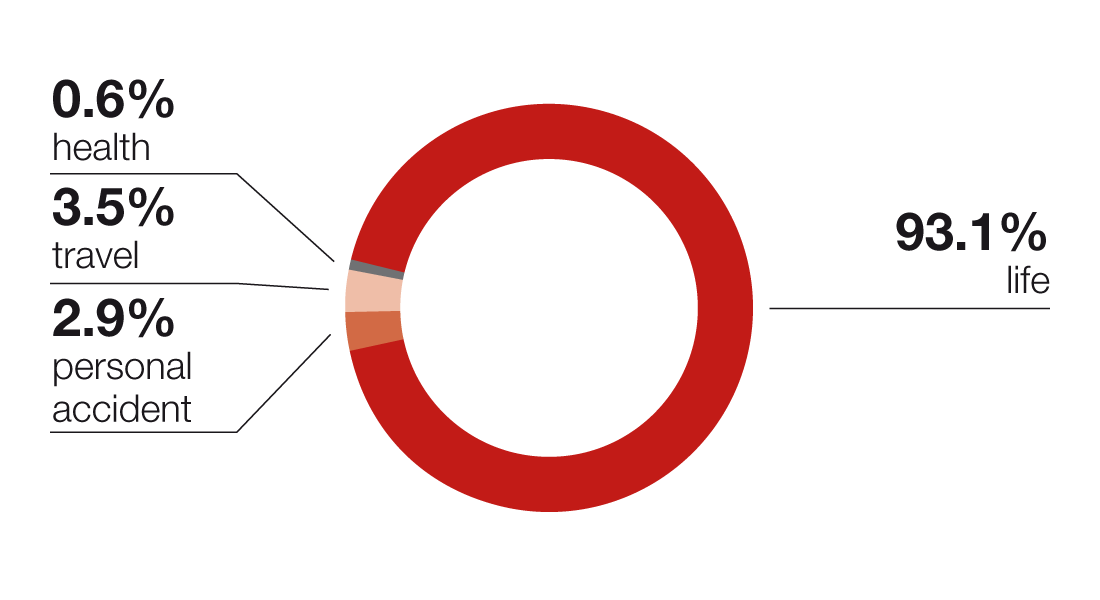
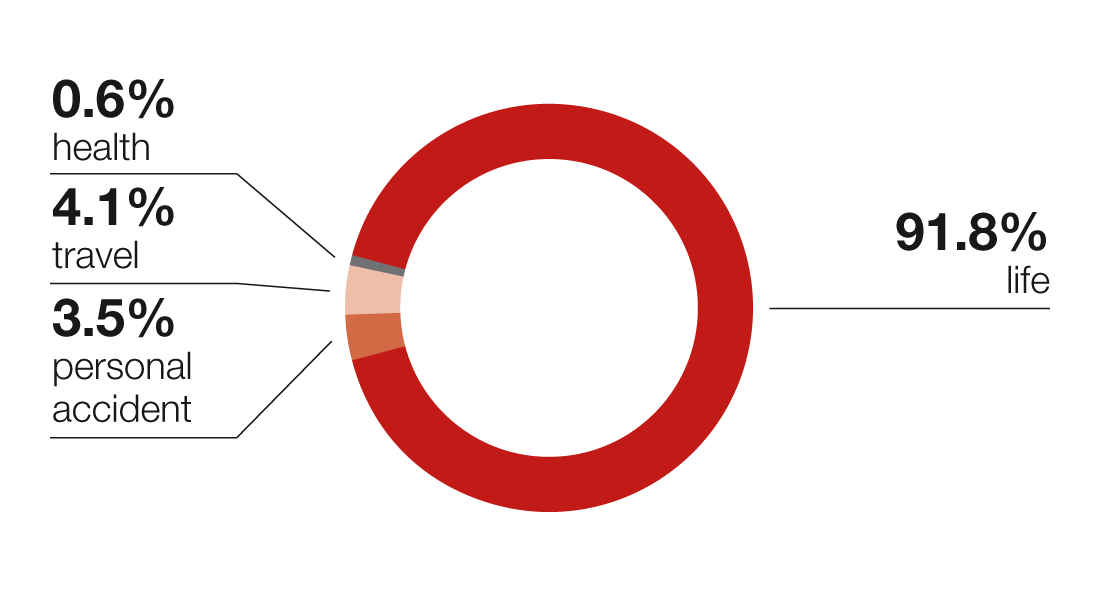
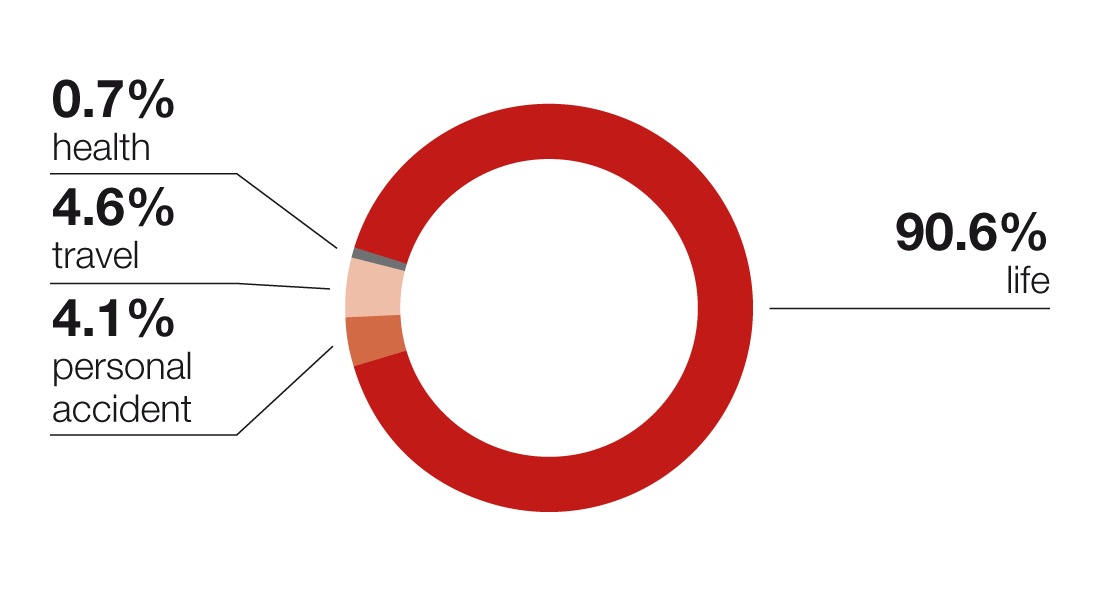
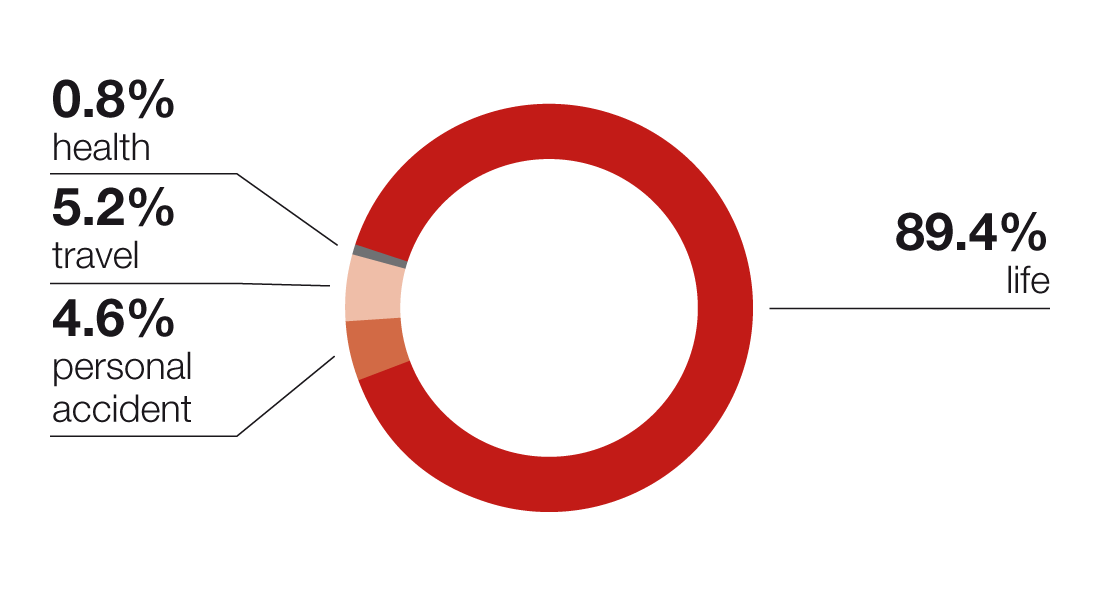
| Life | 2,991.4 | 91.8% | 2,812.5 | 90.6% | 2,790.1 | 89.4% |
| Personal accident | 114.0 | 3.5% | 125.7 | 4.1% | 143.3 | 4.6% |
| Travel | 133.0 | 4.1% | 142.8 | 4.6% | 163.4 | 5.2% |
| Health | 21.0 | 0.6% | 23.1 | 0.7% | 24.0 | 0.8% |
| Total | 3,259.4 | 100.0% | 3,104.2 | 100.0% | 3,120.8 | 100.0% |
2016
2015
2014
2013
2012
2011
Property Insurance and Other Non-life Insurance
| CZK millions | 2016 | % | 2015 | % | 2014 | % |
|---|---|---|---|---|---|---|
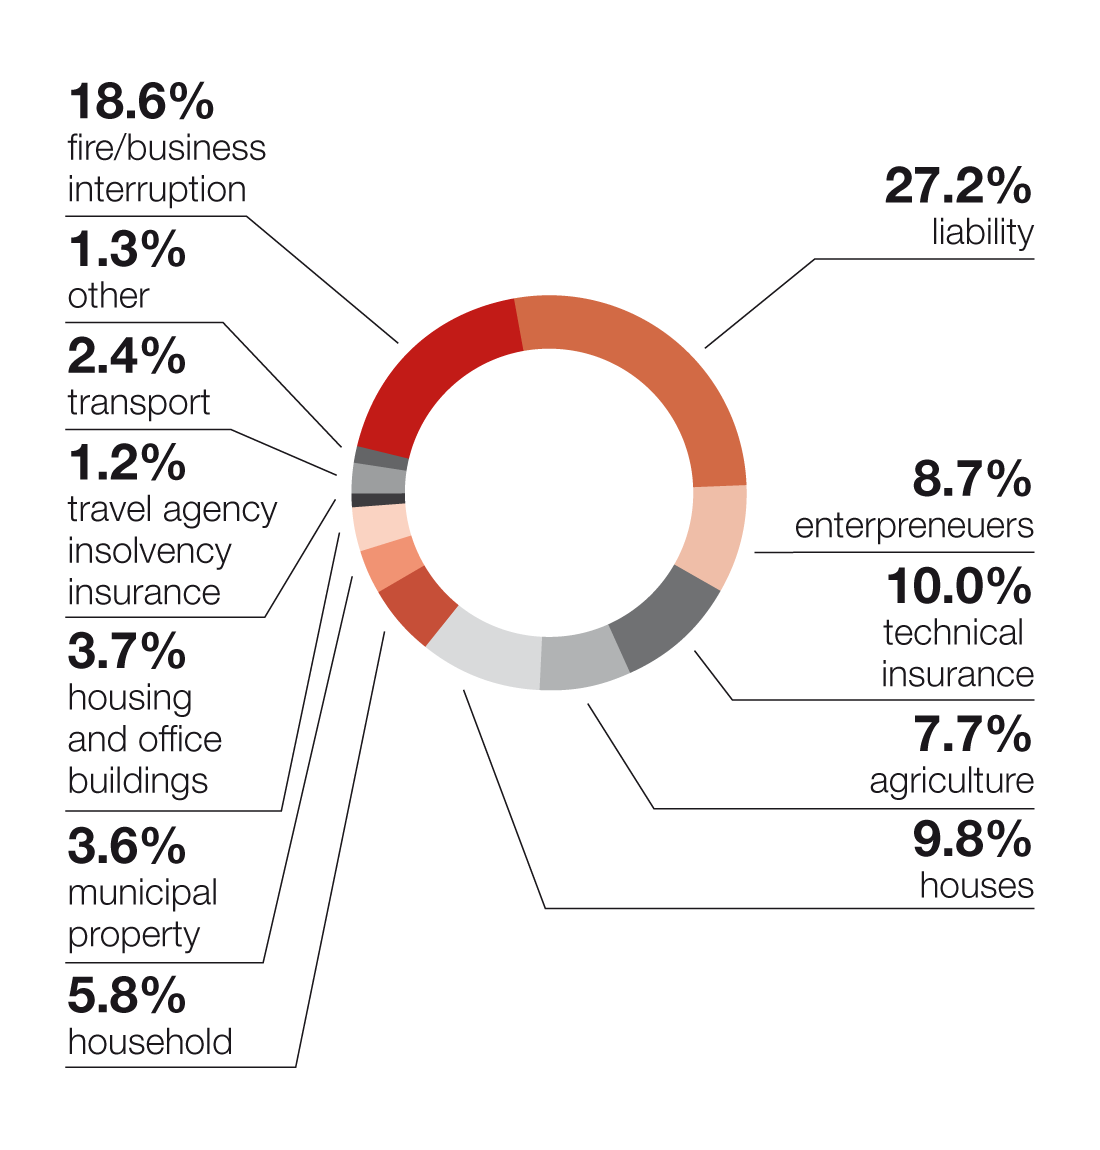
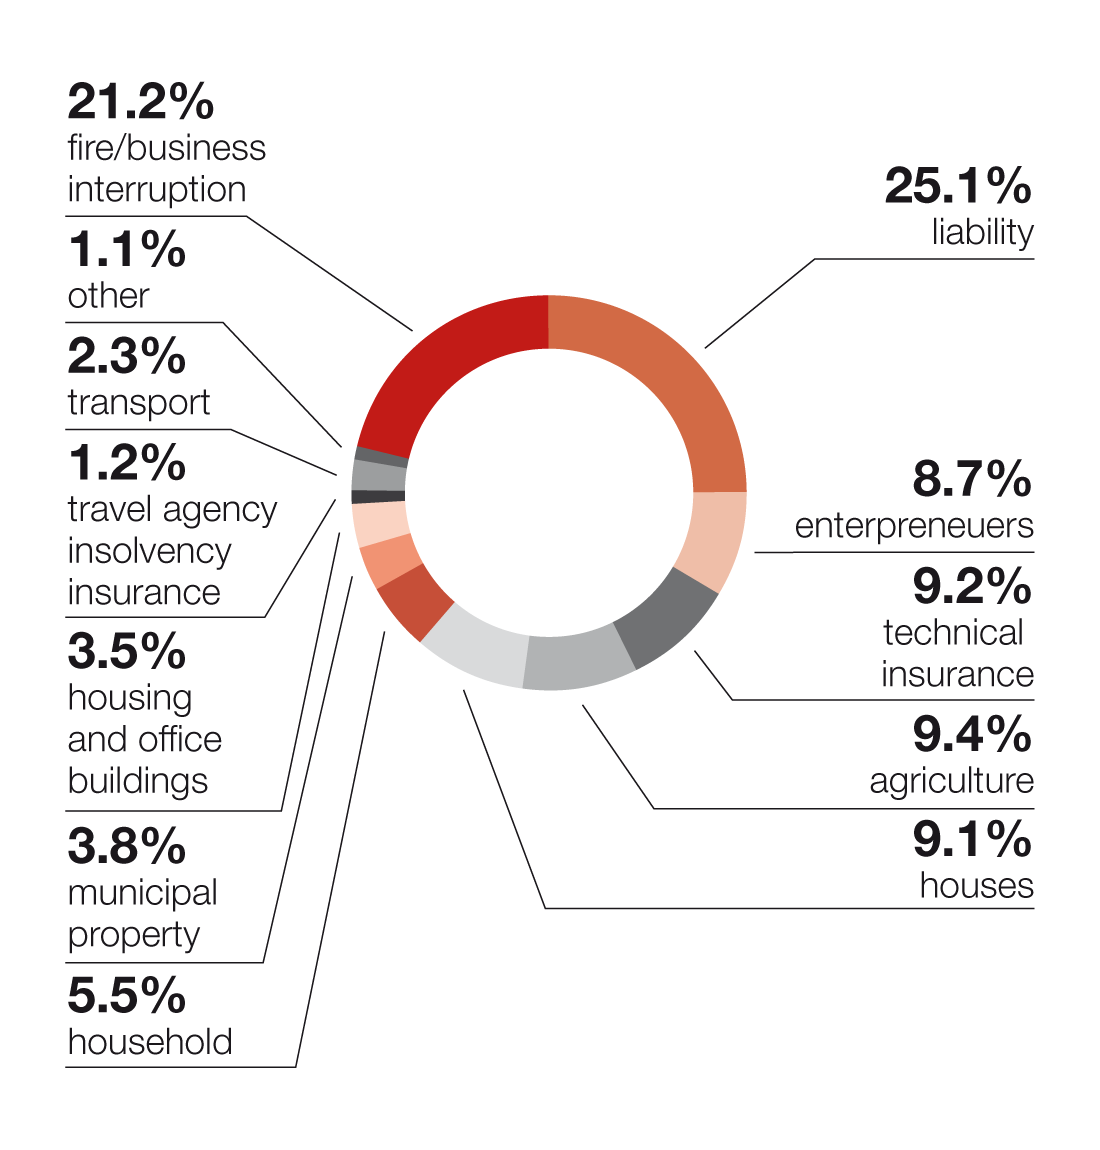
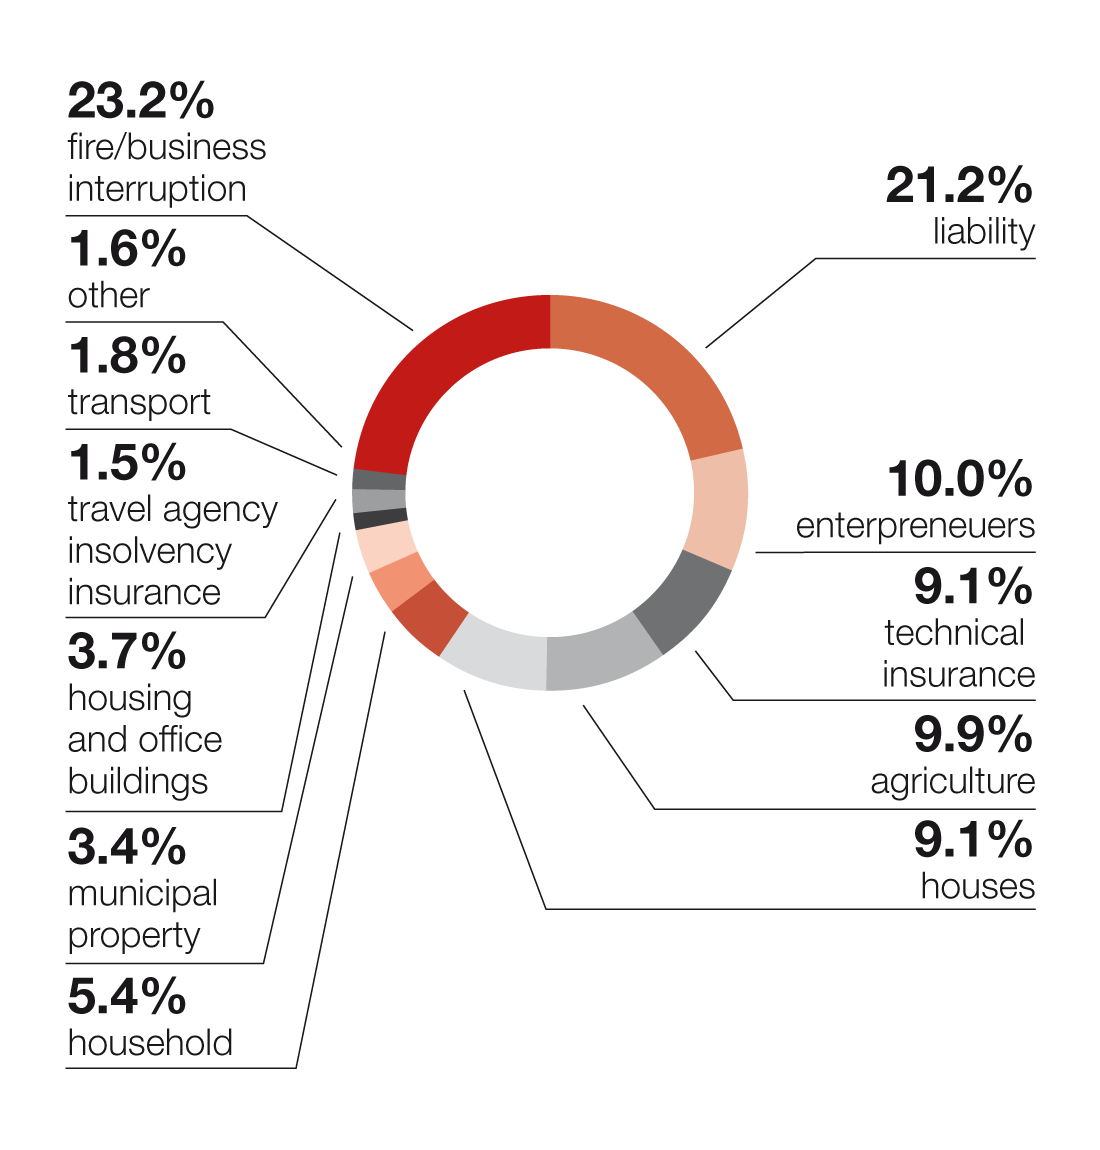
| Fire/business interruption | 435.0 | 18.6% | 524.5 | 21.2% | 507.8 | 20.7% |
| Liability | 634.7 | 27.2% | 622.1 | 25.1% | 607.3 | 24.7% |
| Entrepreneurs | 202.6 | 8.7% | 215.2 | 8.7% | 224.2 | 9.1% |
| Technical insurance | 233.3 | 10.0% | 227.2 | 9.2% | 199.5 | 8.1% |
| Agriculture | 180.3 | 7.7% | 233.7 | 9.4% | 238.9 | 9.7% |
| Houses | 228.0 | 9.8% | 226.1 | 9.1% | 229.4 | 9.3% |
| Household | 135.8 | 5.8% | 135.3 | 5.5% | 136.7 | 5.6% |
| Municipal property | 85.2 | 3.6% | 93.4 | 3.8% | 96.3 | 3.9% |
| Housing and office buildings | 86.9 | 3.7% | 86.9 | 3.5% | 88.3 | 3.6% |
| Travel agency insolvency insurance | 28.5 | 1.2% | 29.6 | 1.2% | 29.4 | 1.2% |
| Transport | 55.5 | 2.4% | 56.1 | 2.3% | 59.7 | 2.4% |
| Other | 30.3 | 1.3% | 28.4 | 1.1% | 40.2 | 1.6% |
| Total | 2,336.1 | 100.0% | 2,478.5 | 100.0% | 2,457.7 | 100.0% |
| CZK millions | 2013 | % | 2012 | % | 2011 | % |
|---|---|---|---|---|---|---|
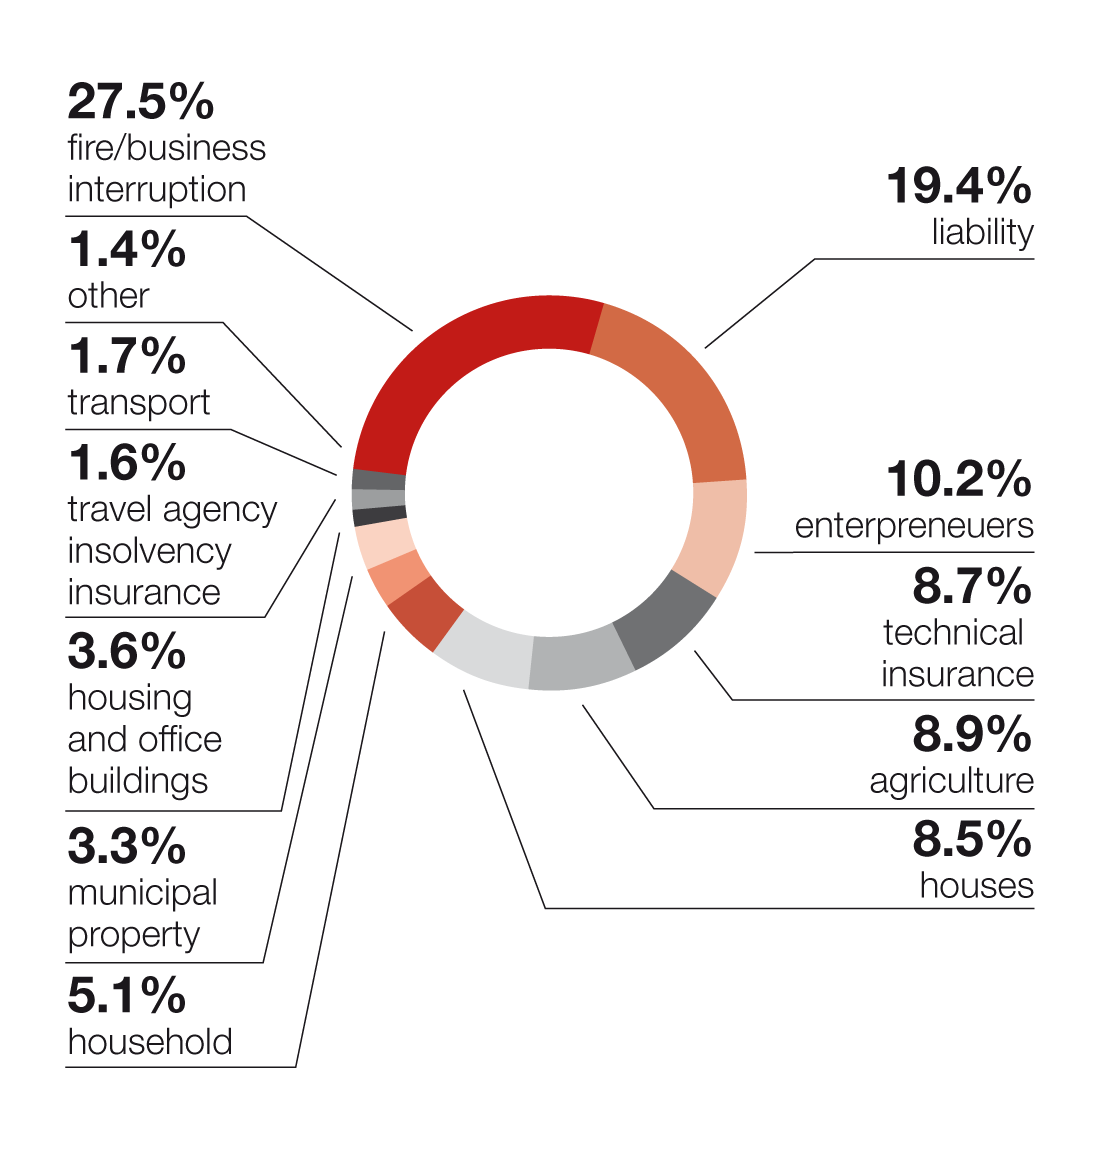
| Fire/business interruption | 523.7 | 21.0% | 597.4 | 23.2% | 743.8 | 27.5% |
| Liability | 572.8 | 23.0% | 546.1 | 21.2% | 524.5 | 19.4% |
| Entrepreneurs | 241.0 | 9.7% | 258.9 | 10.0% | 275.5 | 10.2% |
| Technical insurance | 199.4 | 8.0% | 235.6 | 9.1% | 235.2 | 8.7% |
| Agriculture | 260.3 | 10.4% | 255.0 | 9.9% | 240.8 | 8.9% |
| Houses | 232.9 | 9.3% | 234.7 | 9.1% | 230.7 | 8.5% |
| Household | 138.7 | 5.6% | 140.2 | 5.4% | 139.0 | 5.1% |
| Municipal property | 91.4 | 3.7% | 87.6 | 3.4% | 88.1 | 3.3% |
| Housing and office buildings | 91.2 | 3.7% | 94.6 | 3.7% | 97.7 | 3.6% |
| Travel agency insolvency insurance | 46.3 | 1.9% | 39.9 | 1.5% | 43.0 | 1.6% |
| Transport | 53.2 | 2.1% | 47.1 | 1.8% | 47.1 | 1.7% |
| Other | 41.7 | 1.7% | 42.1 | 1.6% | 38.1 | 1.4% |
| Total | 2,492.5 | 100.0% | 2,579.3 | 100.0% | 2,703.5 | 100.0% |
2016
2015
2014

2013

2012
2011
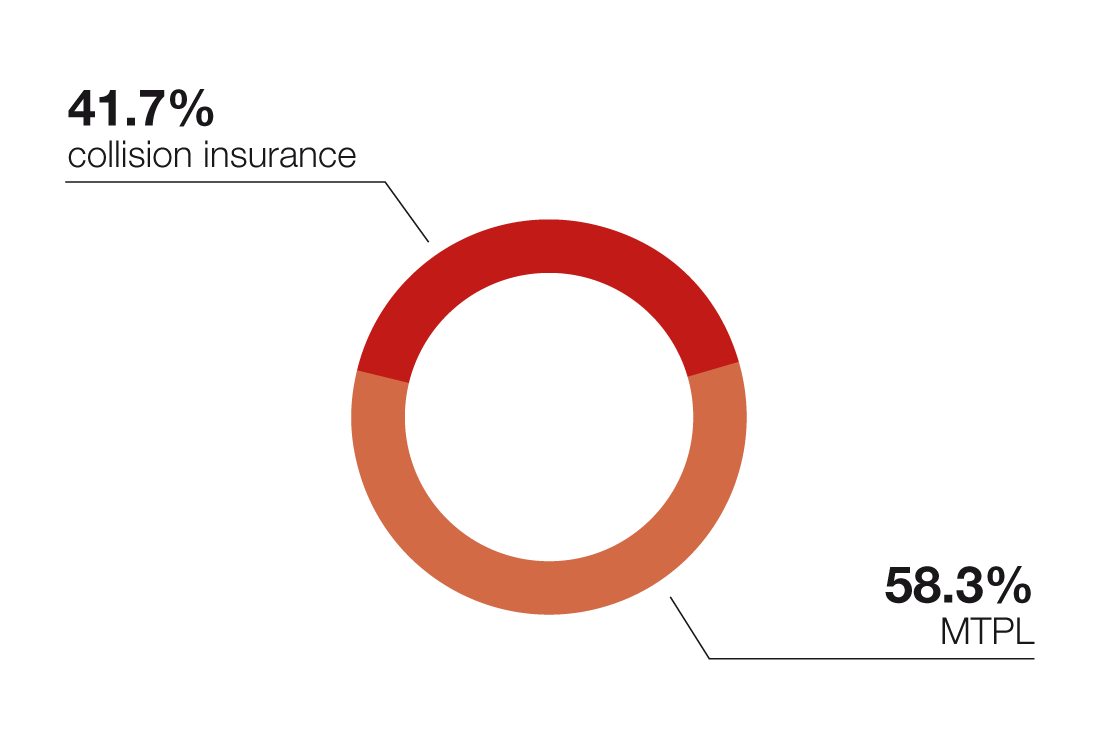
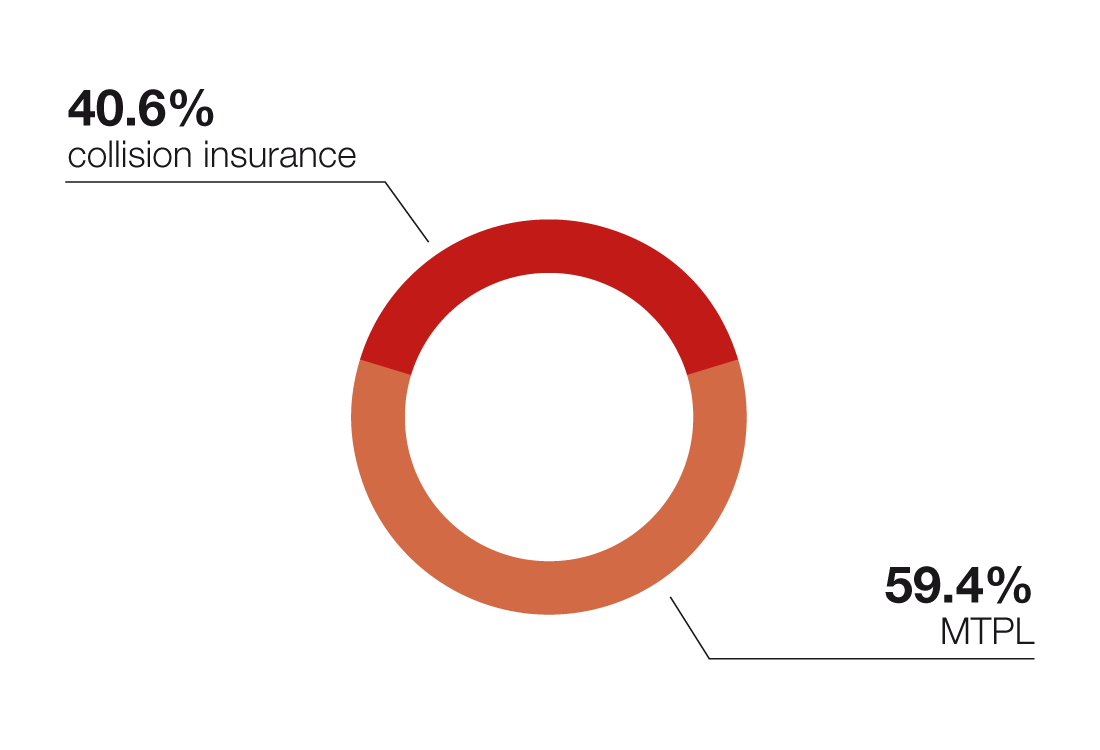
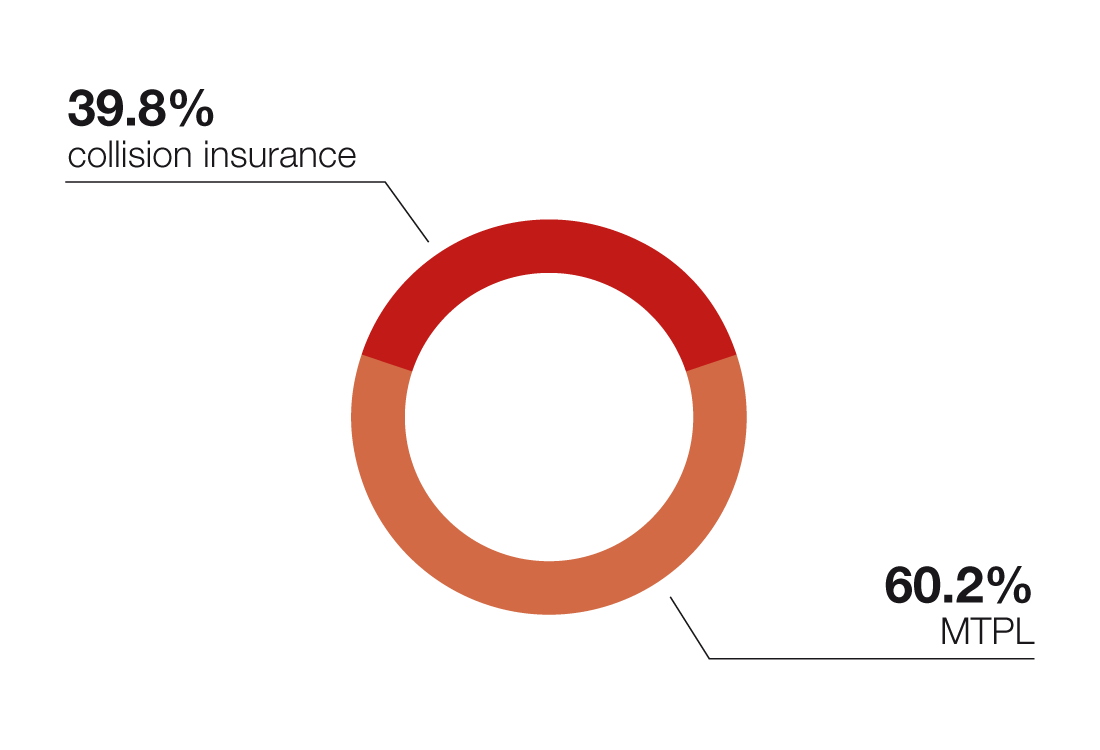
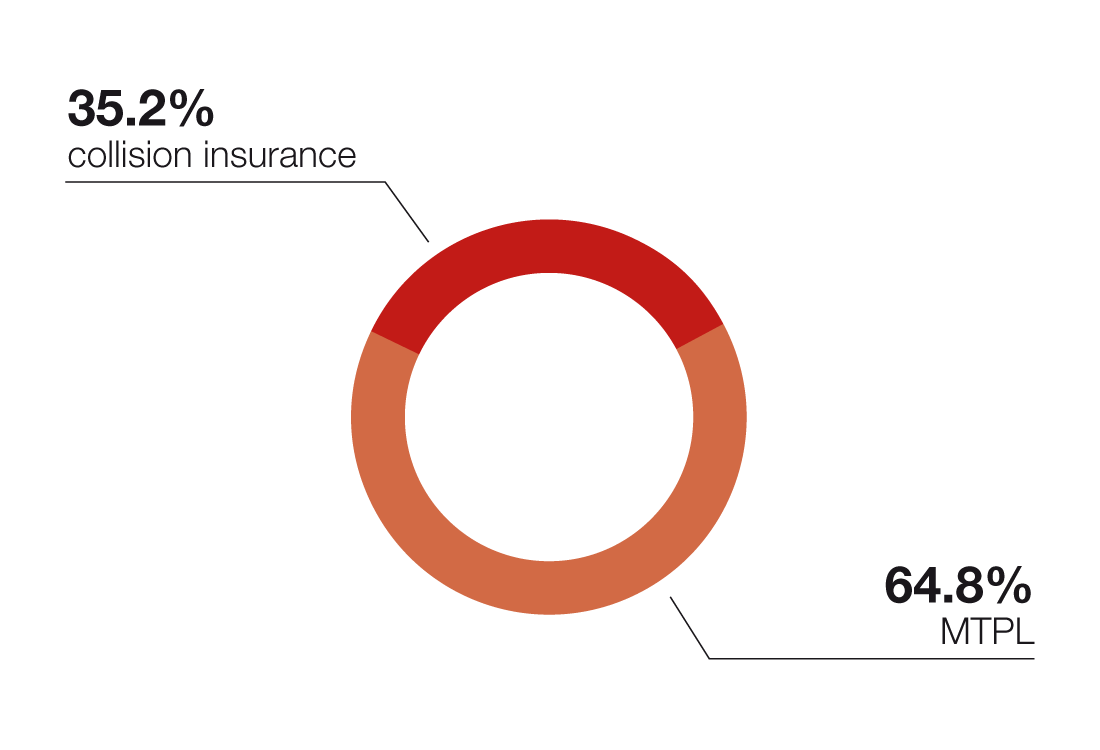
Motor Insurance
| CZK millions | 2016 | % | 2015 | % | 2014 | % |
|---|---|---|---|---|---|---|
| Collision insurance | 1,309.9 | 43.2% | 1,167.1 | 41.7% | 1,049.0 | 40.6% |
| MTPL | 1,721.5 | 56.8% | 1,634.1 | 58.3% | 1,533.7 | 59.4% |
| Total | 3,031.4 | 100.0% | 2,801.2 | 100.0% | 2,582.7 | 100.0% |
| CZK millions | 2013 | % | 2012 | % | 2011 | % |
|---|---|---|---|---|---|---|
| Collision insurance | 934.4 | 39.8% | 911.4 | 37.6% | 994.7 | 35.2% |
| MTPL | 1,411.4 | 60.2% | 1,510.5 | 62.4% | 1,830.5 | 64.8% |
| Total | 2,345.8 | 100.0% | 2,421.9 | 100.0% | 2,825.2 | 100.0% |
2016
2015
2014
2013
2012

2011
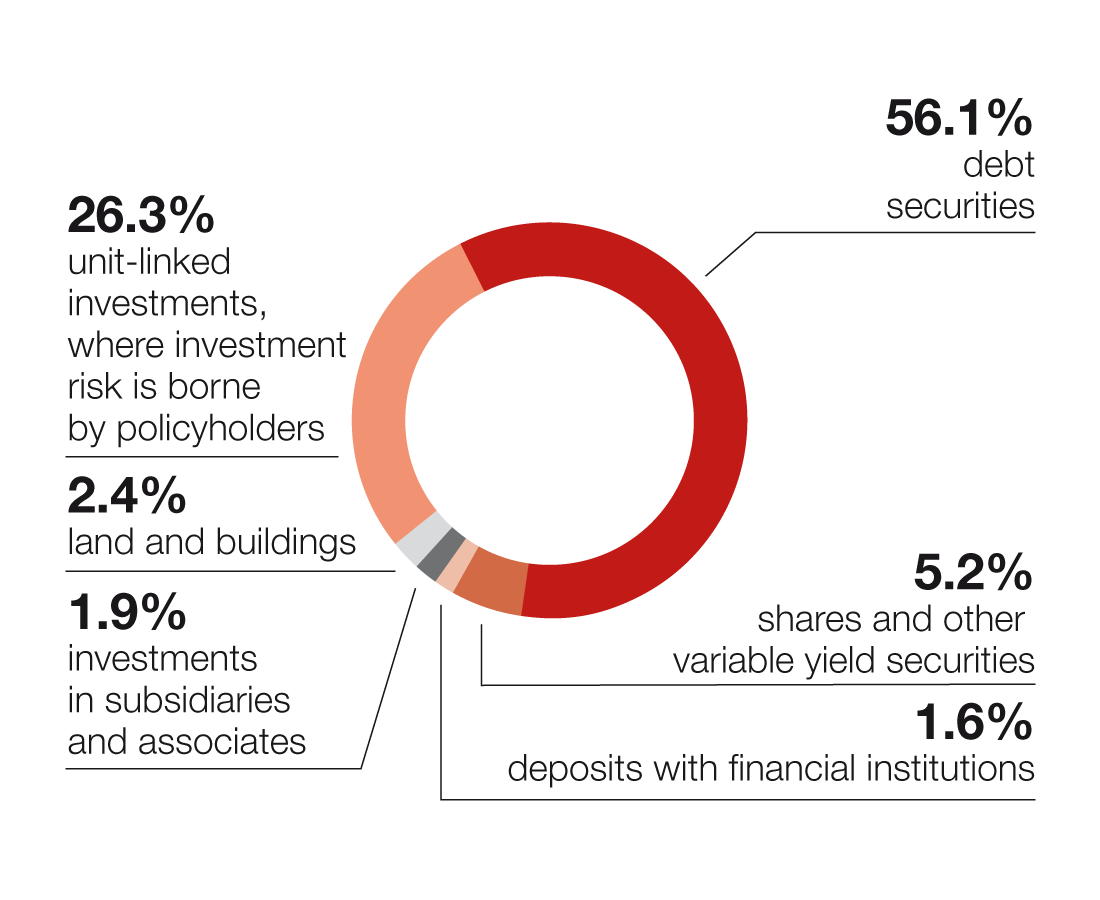
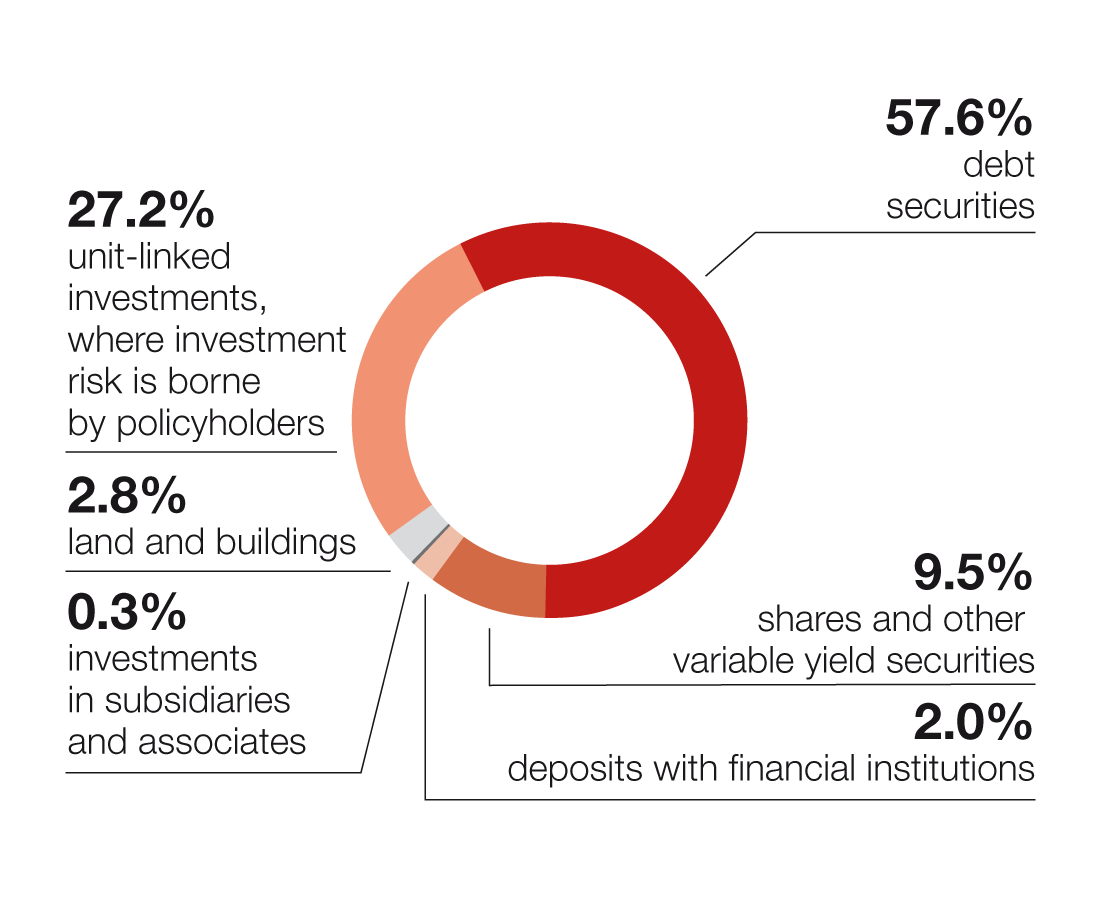
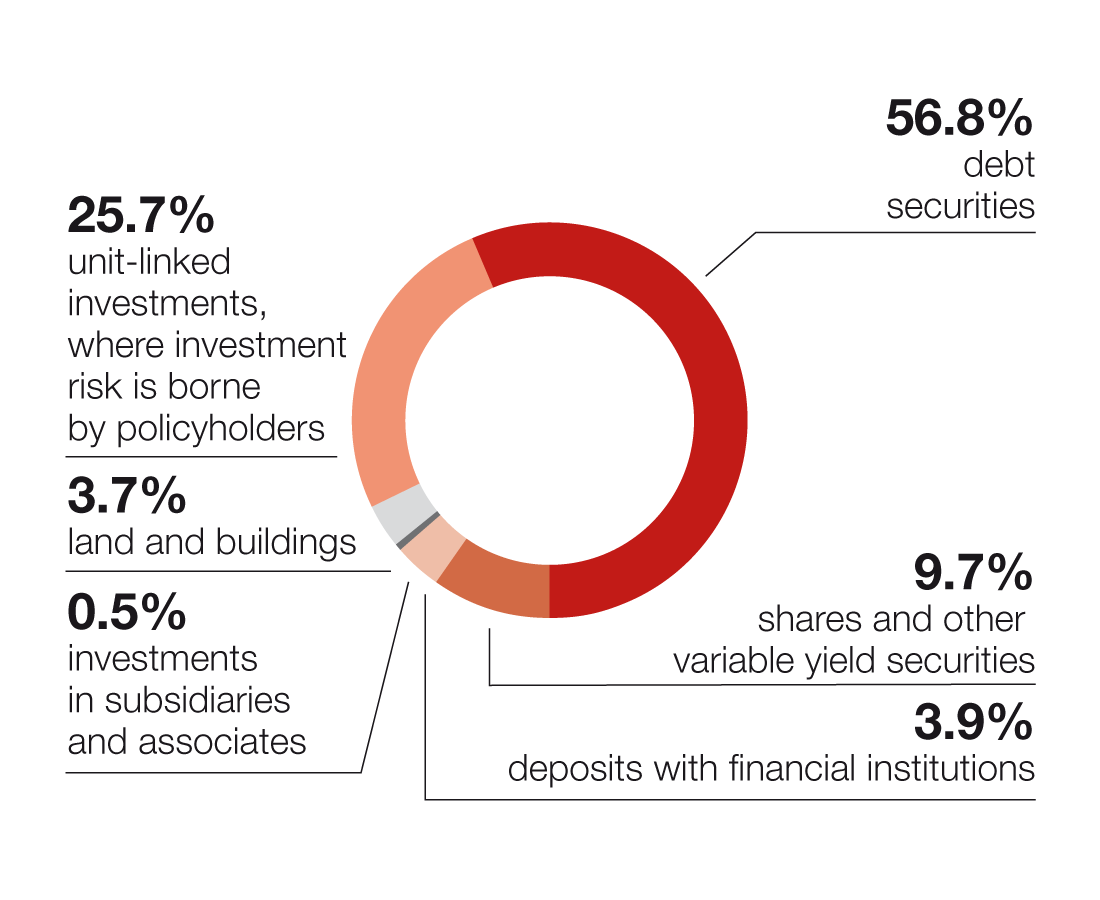
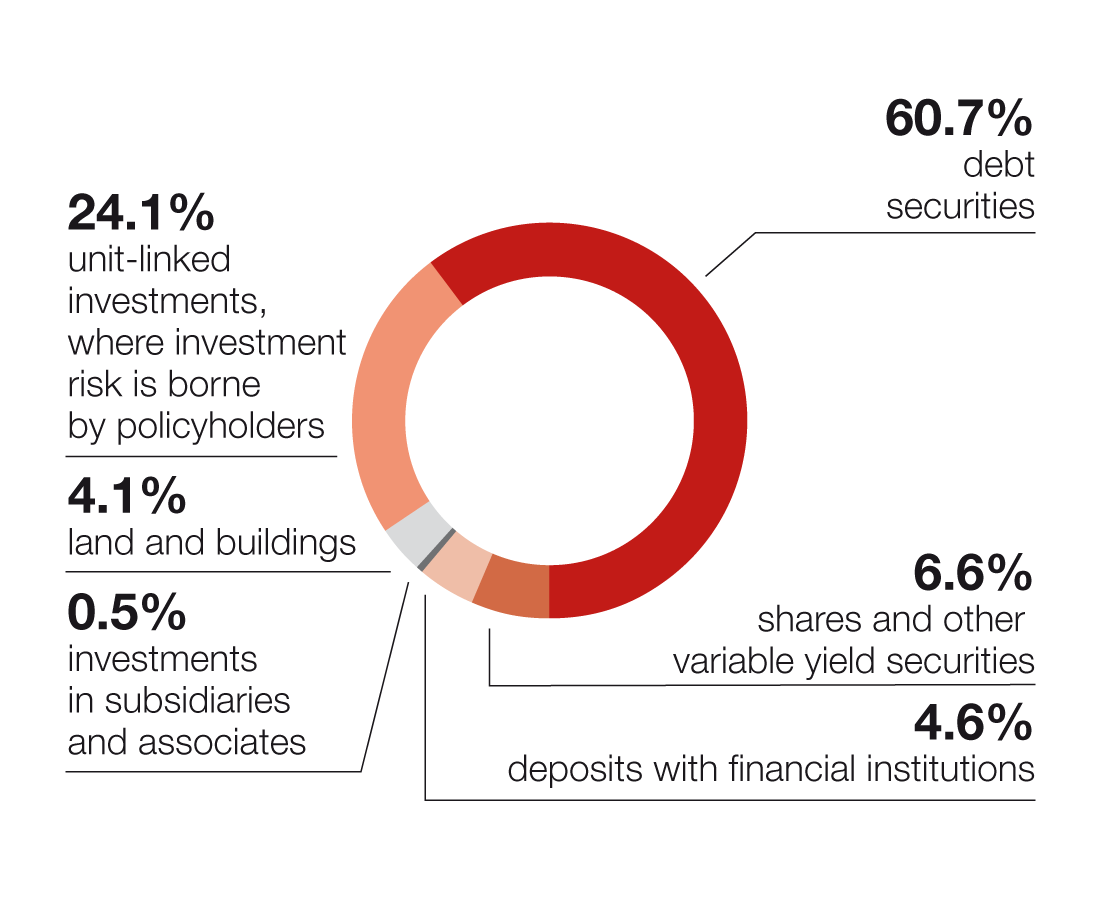
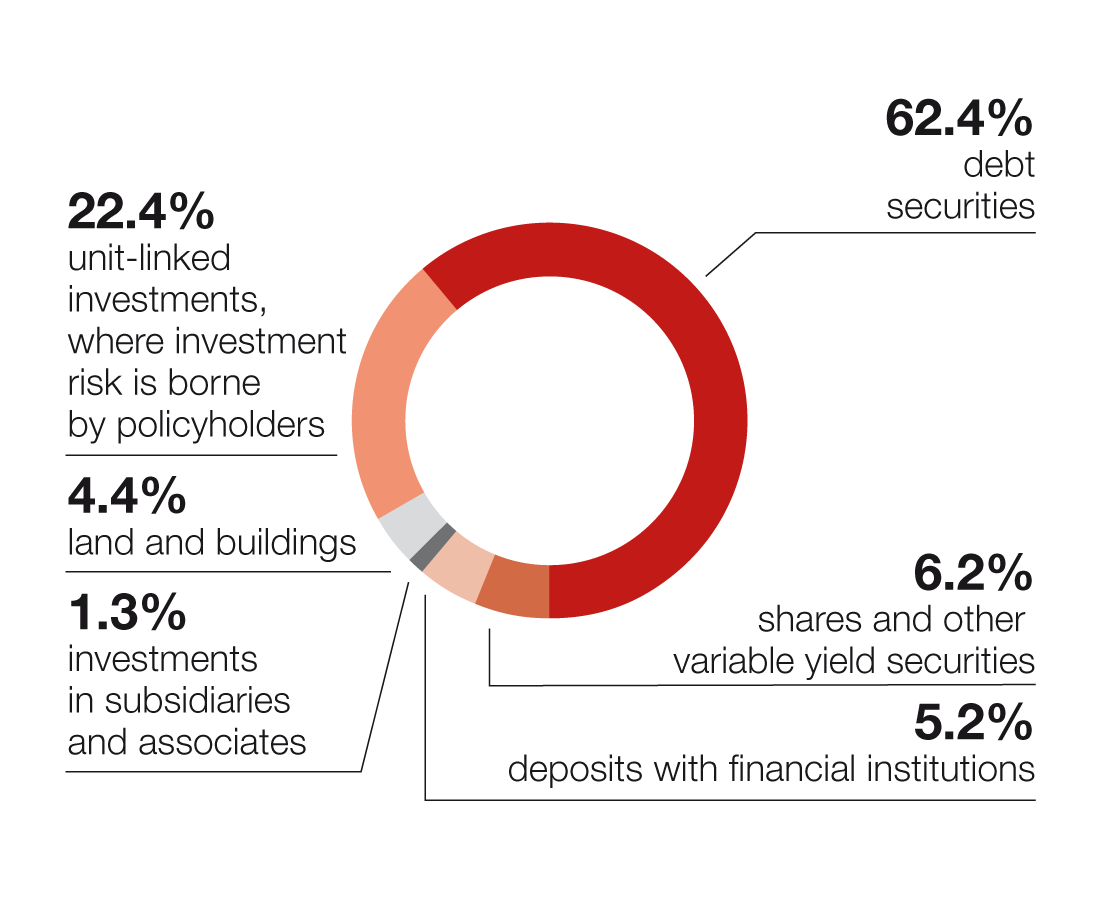
Financial Asset Structure
| CZK millions | 2016 | % | 2015 | % | 2014 | % |
|---|---|---|---|---|---|---|
| Debt securities | 12,764.2 | 56.1% | 11,571.9 | 57.6% | 10,552.0 | 56.8% |
| Shares and other variable yield securities | 1,182.2 | 5.2% | 1,910.6 | 9.5% | 1,799.9 | 9.7% |
| Deposits with financial institutions | 357.7 | 1.6% | 410.6 | 2.0% | 724.6 | 3.9% |
| Investments in subsidiaries and associates | 437.9 | 1.9% | 51.8 | 0.3% | 93.7 | 0.5% |
| Land and buildings | 536.1 | 2.4% | 570.2 | 2.8% | 678.7 | 3.7% |
| Other loans | 1,582.8 | 7.0% | 93.3 | 0.5% | 3.0 | 0.0% |
| Other investments | -113.6 | -0.5% | 29.9 | 0.1% | -37.9 | -0.2% |
| Unit-linked investments, where investment risk is borne by policyholders | 5,991.0 | 26.3% | 5,465.3 | 27.2% | 4,766.5 | 25.7% |
| Total | 22,738.3 | 100.0% | 20,103.6 | 100.0% | 18,580.5 | 100.0% |
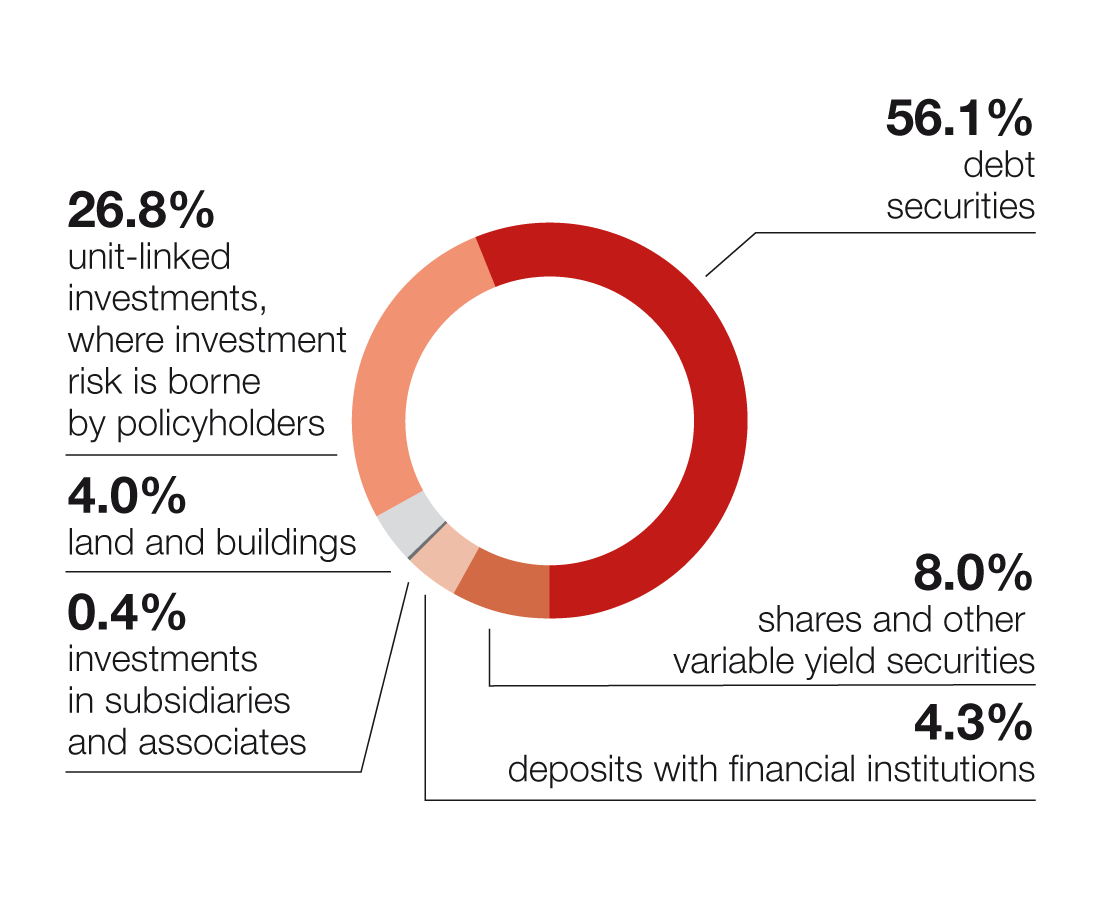
| CZK millions | 2013 | % | 2012 | % | 2011 | % |
|---|---|---|---|---|---|---|
| Debt securities | 10,007.8 | 56.1% | 10,816.3 | 60.7% | 10,159.7 | 62.4% |
| Shares and other variable yield securities | 1,432.5 | 8.0% | 1,172.2 | 6.6% | 1,004.5 | 6.2% |
| Deposits with financial institutions | 772.4 | 4.3% | 813.4 | 4.6% | 843.0 | 5.2% |
| Investments in subsidiaries and associates | 78.9 | 0.4% | 85.4 | 0.5% | 206.9 | 1.3% |
| Land and buildings | 713.2 | 4.0% | 723.0 | 4.1% | 717.1 | 4.4% |
| Other loans | 3.4 | 0.0% | 5.4 | 0.0% | 5.2 | 0.0% |
| Other investments | 38.9 | 0.2% | -98.5 | -0.6% | -295.0 | -1.8% |
| Unit-linked investments, where investment risk is borne by policyholders | 4,787.6 | 26.8% | 4,290.6 | 24.1% | 3,643.7 | 22.4% |
| Total | 17,834.7 | 100.0% | 17,807.7 | 100.0% | 16,285.2 | 100.0% |
2016
2015
2014
2013
2012
2011
Solvency
Insurance is a regulated industry and the Company must meet the requirements of Act No 277/2009 on insurance and (as of 2016) EU Regulation No 306/2016, including capital adequacy requirements. The Company calculates its solvency margin (i.e. the ratio between the Company’s own resources and the solvency capital requirement to cover quantifiable risks) using the standard formula defined by the Solvency II Regulation.
Preliminary calculations showed that, as at 31 December 2016, the Company met the regulatory solvency margin requirements. The final solvency margin results will be available after the date of publication of this Annual Report and therefore will be not be released until the Solvency and Financial Condition Report (SFCR) is published at the end of May 2017.
Developments in solvency indicators according to the previous regulation
| CZK thousands | 2015 | 2014 | 2013 | |||
|---|---|---|---|---|---|---|
| Non-life insurance | Life insurance | Non-life insurance | Life insurance | Non-life insurance | Life insurance | |
| Solvency capital requirement | 656,293 | 471,657 | 656,293 | 455,007 | 656,239 | 437,673 |
| Available solvency capital | 1,386,761 | 1,225,059 | 1,279,751 | 876,233 | 1,062,897 | 853,350 |
| Available and required solvency capital ratio | 2.11 | 2.60 | 1.95 | 1.93 | 1.62 | 1.95 |
| Minimum solvency capital | 375,983 | 370,433 | 364,655 | |||
| Minimum and available solvency capital ratio | 0.14 | 0.17 | 0.19 | |||
| CZK thousands | 2012 | 2011 | 2010 | |||
|---|---|---|---|---|---|---|
| Non-life insurance | Life insurance | Non-life insurance | Life insurance | Non-life insurance | Life insurance | |
| Solvency capital requirement | 656,293 | 437,548 | 656,293 | 424,707 | 656,293 | 412,283 |
| Available solvency capital | 1,114,629 | 1,066,515 | 828,151 | 768,378 | 1,434,157 | 1,012,356 |
| Available and required solvency capital ratio | 1.70 | 2.44 | 1.26 | 1.81 | 2.19 | 2.46 |
| Minimum solvency capital | 364,614 | 360,333 | 356,192 | |||
| Minimum and available solvency capital ratio | 0.17 | 0.23 | 0.15 | |||
Ratios
| 2016 | 2015 | 2014 | 2013 | 2012 | 2011 | |
|---|---|---|---|---|---|---|
| Return on average assets (ROAA) (profit or loss for the accounting period/total assets) | 1.95% | 2.35% | 1.30% | -0.23% | 3.35% | 0.85% |
| Return on average equity (ROAE) (profit or loss for the accounting period/equity) | 15.41% | 19.27% | 11.59% | -2.19% | 28.76% | 9.15% |
| Non-life combined ratio | 102.13% | 95.96% | 98.36% | 104.43% | 100.14% | 99.94% |